Your ads dashboard comes with a ton of easy-to-digest data cards, sharing and tracking for your campaign over time.
Performance overview
By adding your campaign ID to the url after the app, for example app.b00st.com/<your-id> you can see your campaign’s dashboard.
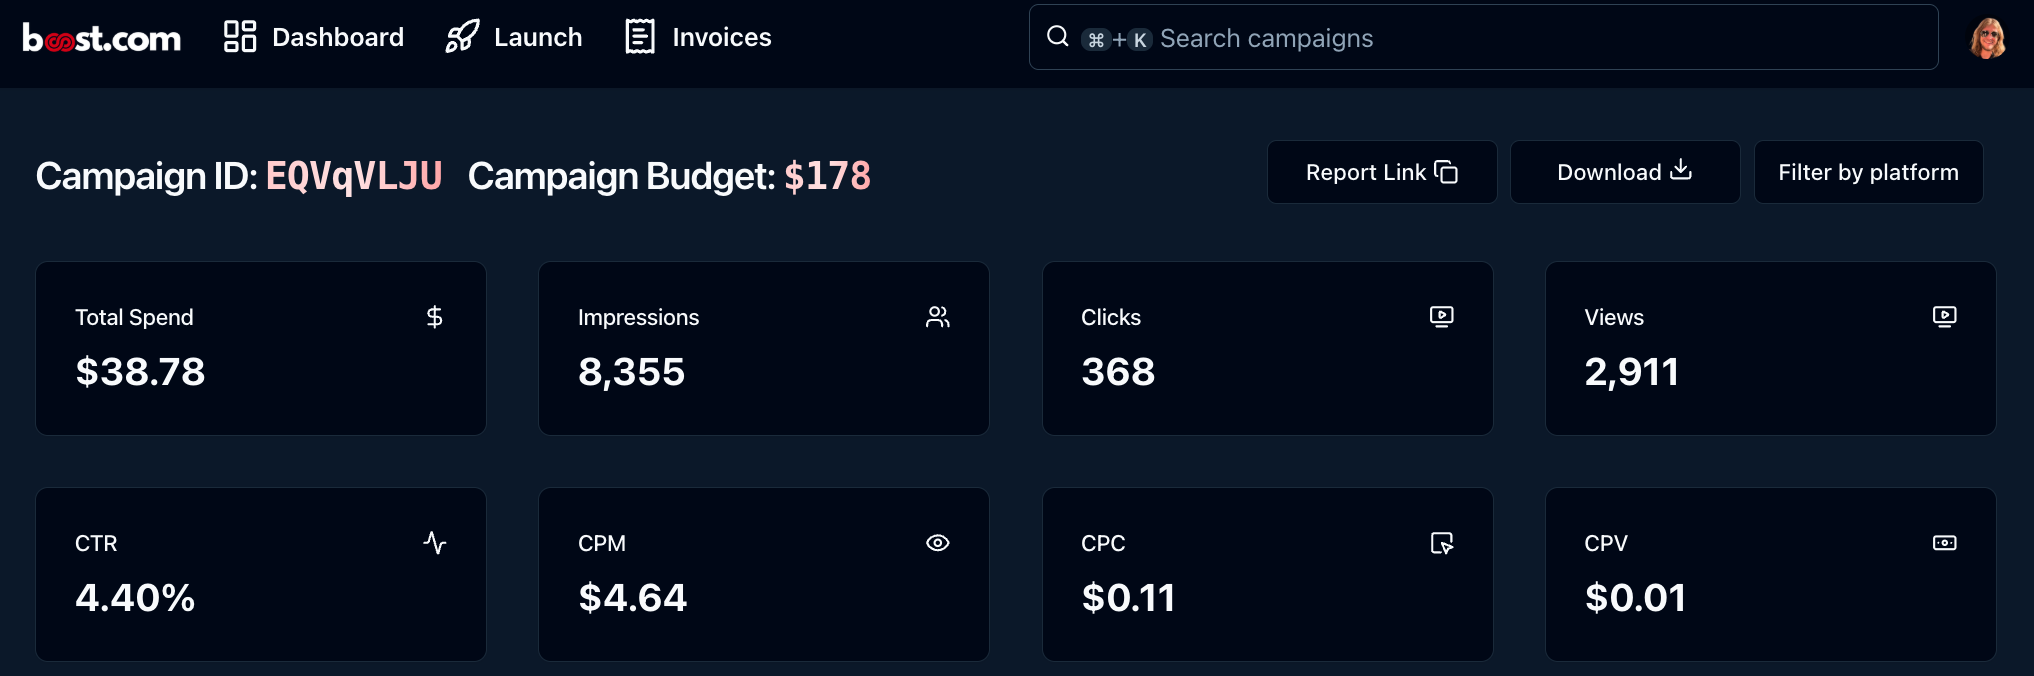
Only authorized users for each campaign can see the default view! To share your report you must click the share button to create a shareable link.
Summary stats
To learn about each stat, you can hover over each one to see an informative dialog, e.g.
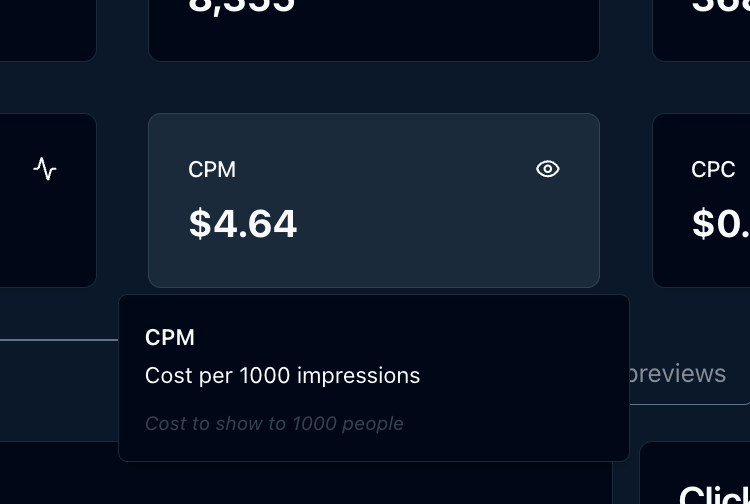
Clicking the card will take you directly to the over-time performance of that metric so you can see how it has changed throughout the campaign.
Share, download and filter
In the top right of the main view you can get a shareable link, which you can send to anyone you’d like. They simply need to sign in to the app and they’ll be redirected to the report you shared.
You also own your data and can download it at anytime, in a simple spreadsheet format, usable in Microsoft Excel, Google Sheets or your spreadsheet software of choice.
And you can filter your report by platform, to see how each one is performing differently or select multiple to see how they’re performing together.
Ad previews
Below the overview section you can expand the ad previews to see a demo/mockup of how your campaign’s creative might look on various types of platforms such as Instagram Reels, TikTok, Facebook and Google Search.
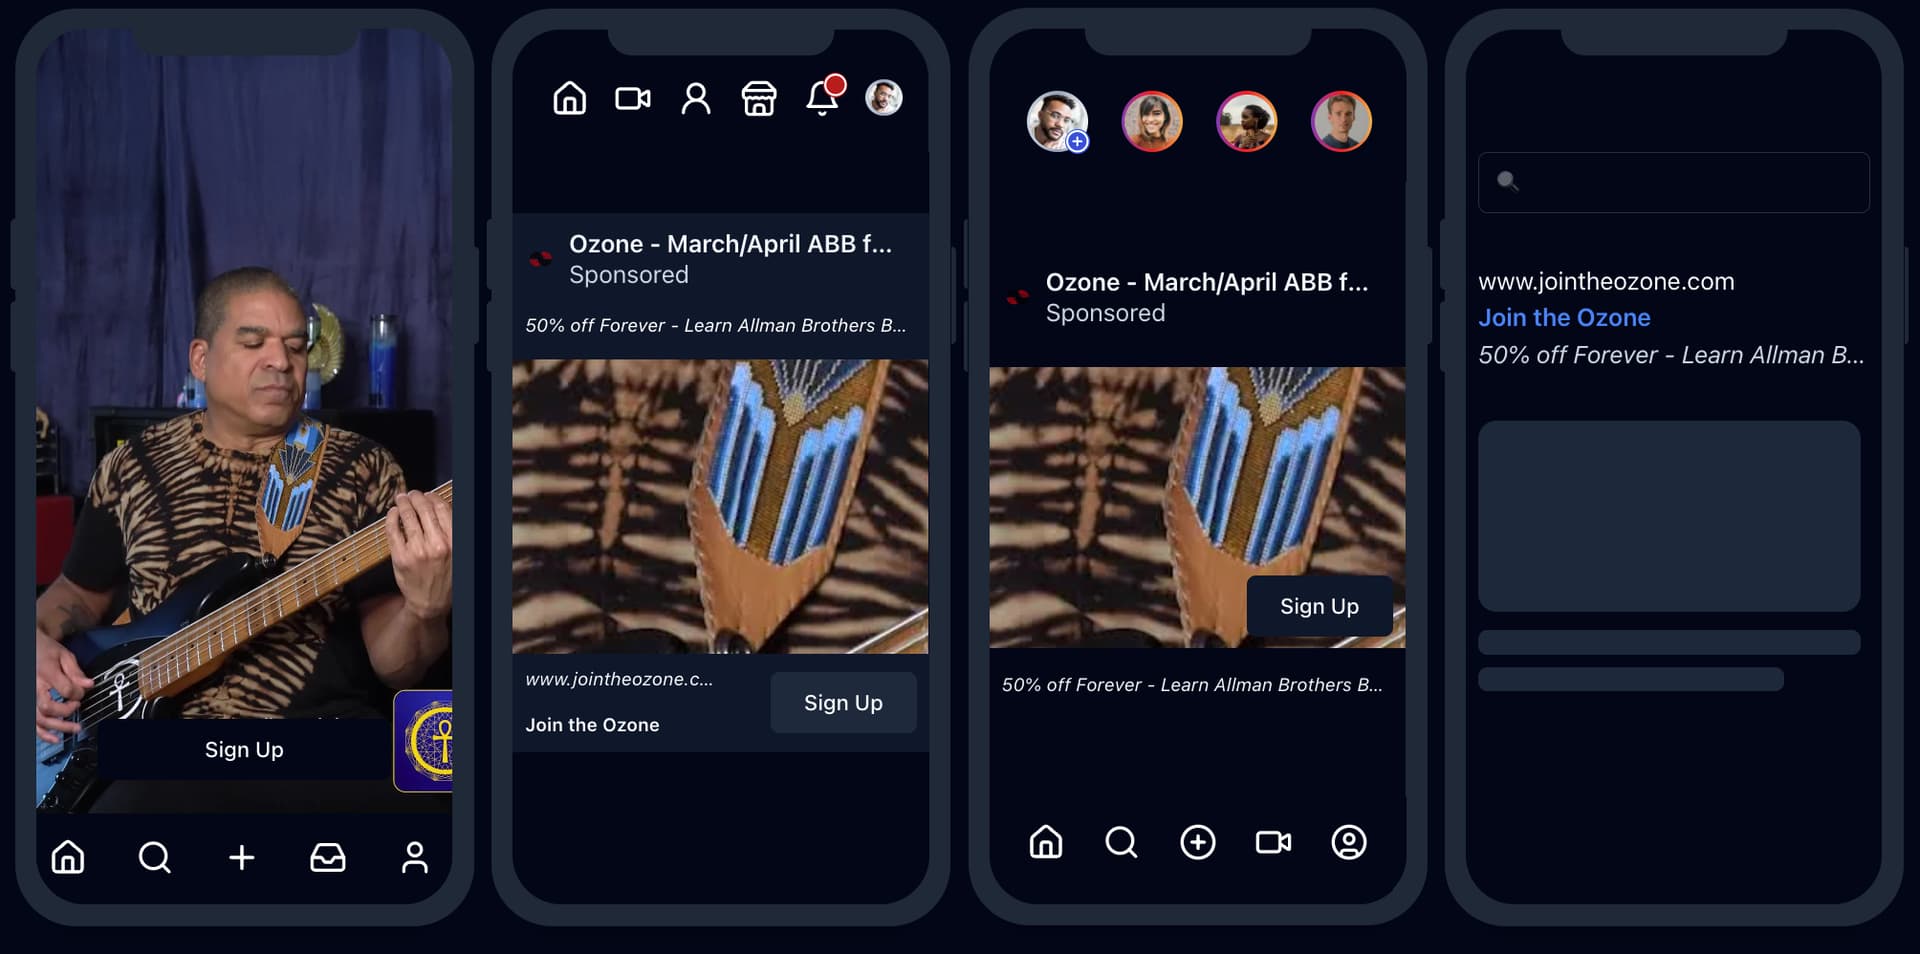
These are not exact replicas of ad platforms. Our team automatically adjusts and uploads your media for the best possible representation on all platforms.
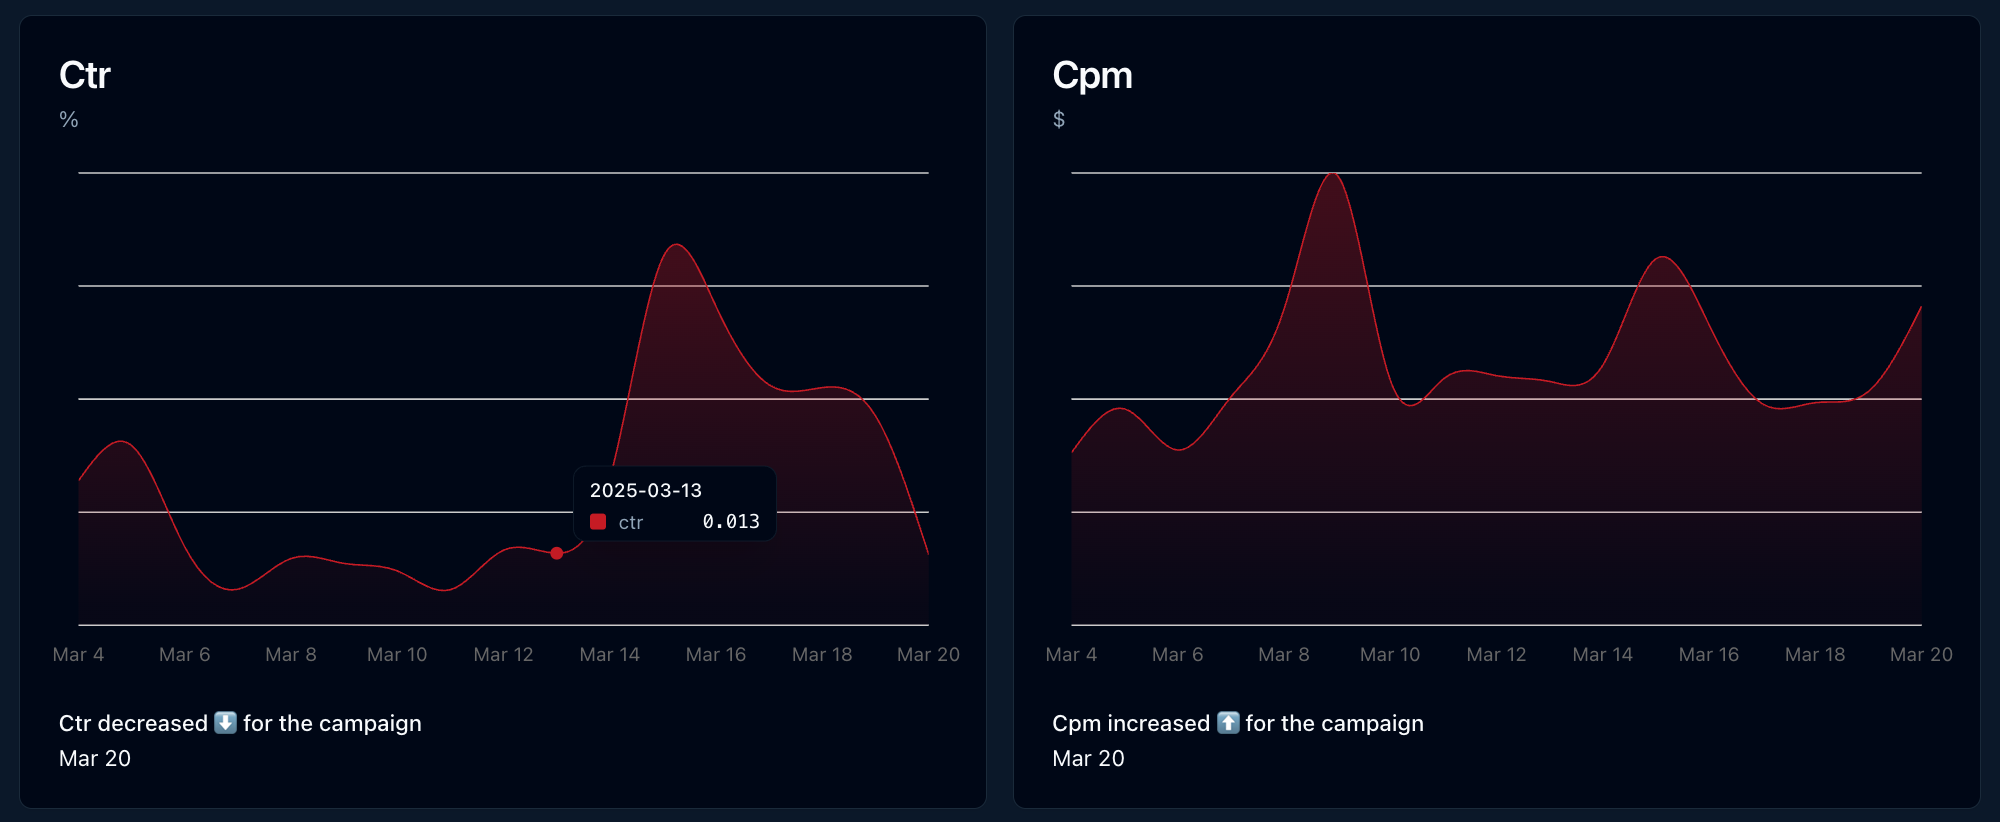
Performance over time
You can also dive deep into each metric’s performance over time. In the below, you can see how Click-through-rate and Cost-per-impression change over this campaign’s life.